In this release:
- Inline Editing of Categories in the Event Log
- Filter events by Category
- Extended sorting functionality in the Event Log
- Reset KPI tracking
- Event Code Set page: Enhanced filtering options
- Split report section by site
- Access new rolled up KPIs at site-level for PV sites
- Improved functionality for Utility Curtailment Setpoint
- Correction to Active Power.Final values
- Active Gross Export Energy
- New calculation supporting NERC GADS reporting for PV
- Device Panel enhancement
Inline Editing of Categories in the Event Log
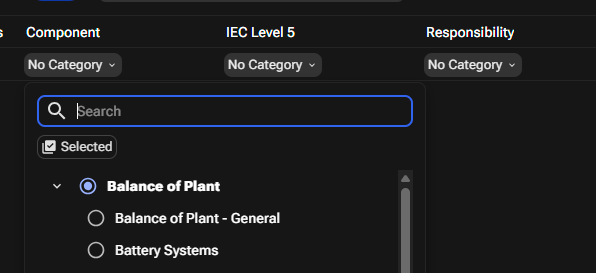
You can now easily update event categories right from the Event Log! This makes it faster to update event categories without need to open each event individually.
- Single-click a category to open the category selector.
- Double-click to open Event Details.
Choose a new category and click Save to apply the change.
The Event Log will automatically refresh with the update.
You can click Cancel to close without saving.
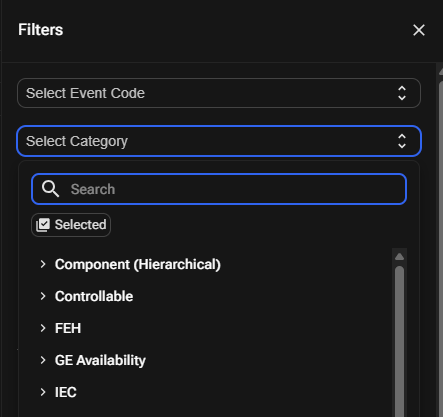
You can now filter the Event Log by multiple categories using the updated Category Selector in the filter panel. Easily search and select categories, see how many are selected, and apply them to view only relevant events.
You can now sort on additional columns of event log to better organize and find the data you need.
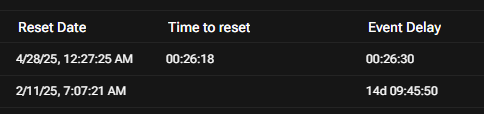
To improve efficiency and reduce manual effort in evaluating reset performance, we've automated the calculation of two key reset delay metrics: Event Delay and Time to Reset. These metrics are now available in the platform’s column selector, enabling quick, accurate analysis of reset response times without the need for manual Excel tracking.
Event Delay: Automatically calculated as the time between the Event Start Time and the Time of the First Reset Log.
Time to Reset: Automatically calculated as the time between the Remote Reset Time and the Event Close Time.
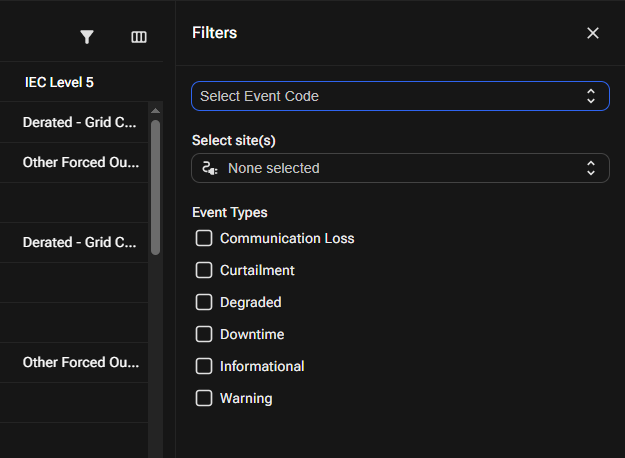
We’ve introduced powerful filtering enhancements to the Event Code Set page, making it faster and easier to locate specific event codes based on specific needs. The new capabilities allow you to:
Filter by Event Code: A filter panel (with an icon button) is now available to search by specific event code(s). After applying, the page updates to display only relevant event codes.
Filter by Event Type: You can now filter the Event Code Set by one or more event types, just like in the Event Log.
Filter by Site: You can filter event codes by site using a searchable dropdown selector. Selecting one or more sites will update the page to show only the codes applicable to those sites.
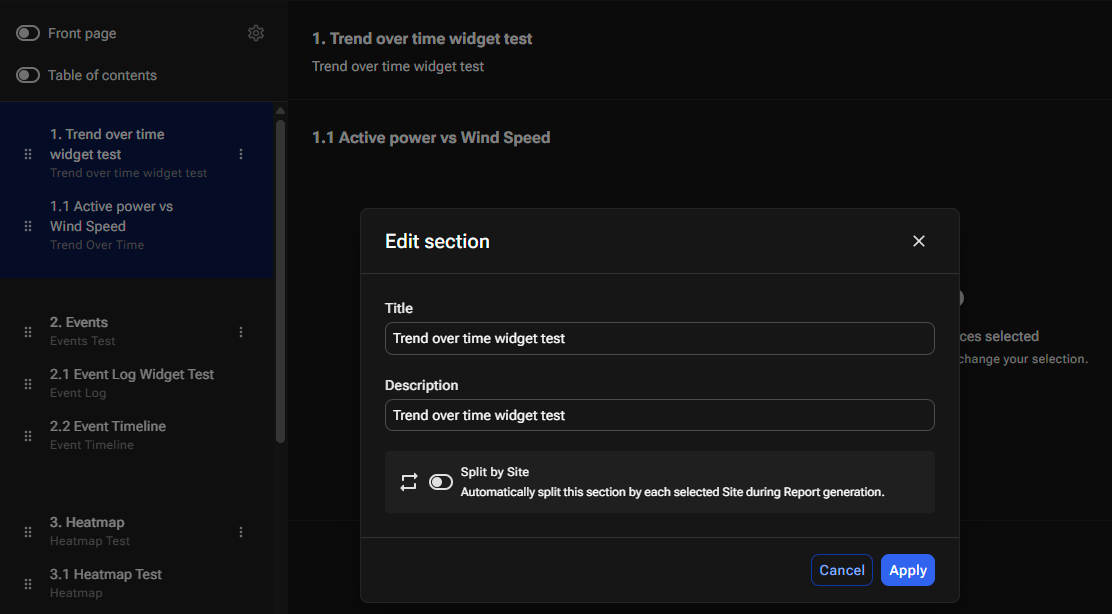
You can now choose to split report sections by site when generating reports.
This option is off by default and can be enabled per section.
When enabled, all widgets in the section are repeated per Site, with the Site name clearly shown in the section title and report index.
Perfect for breaking down data when reporting across multiple Sites.
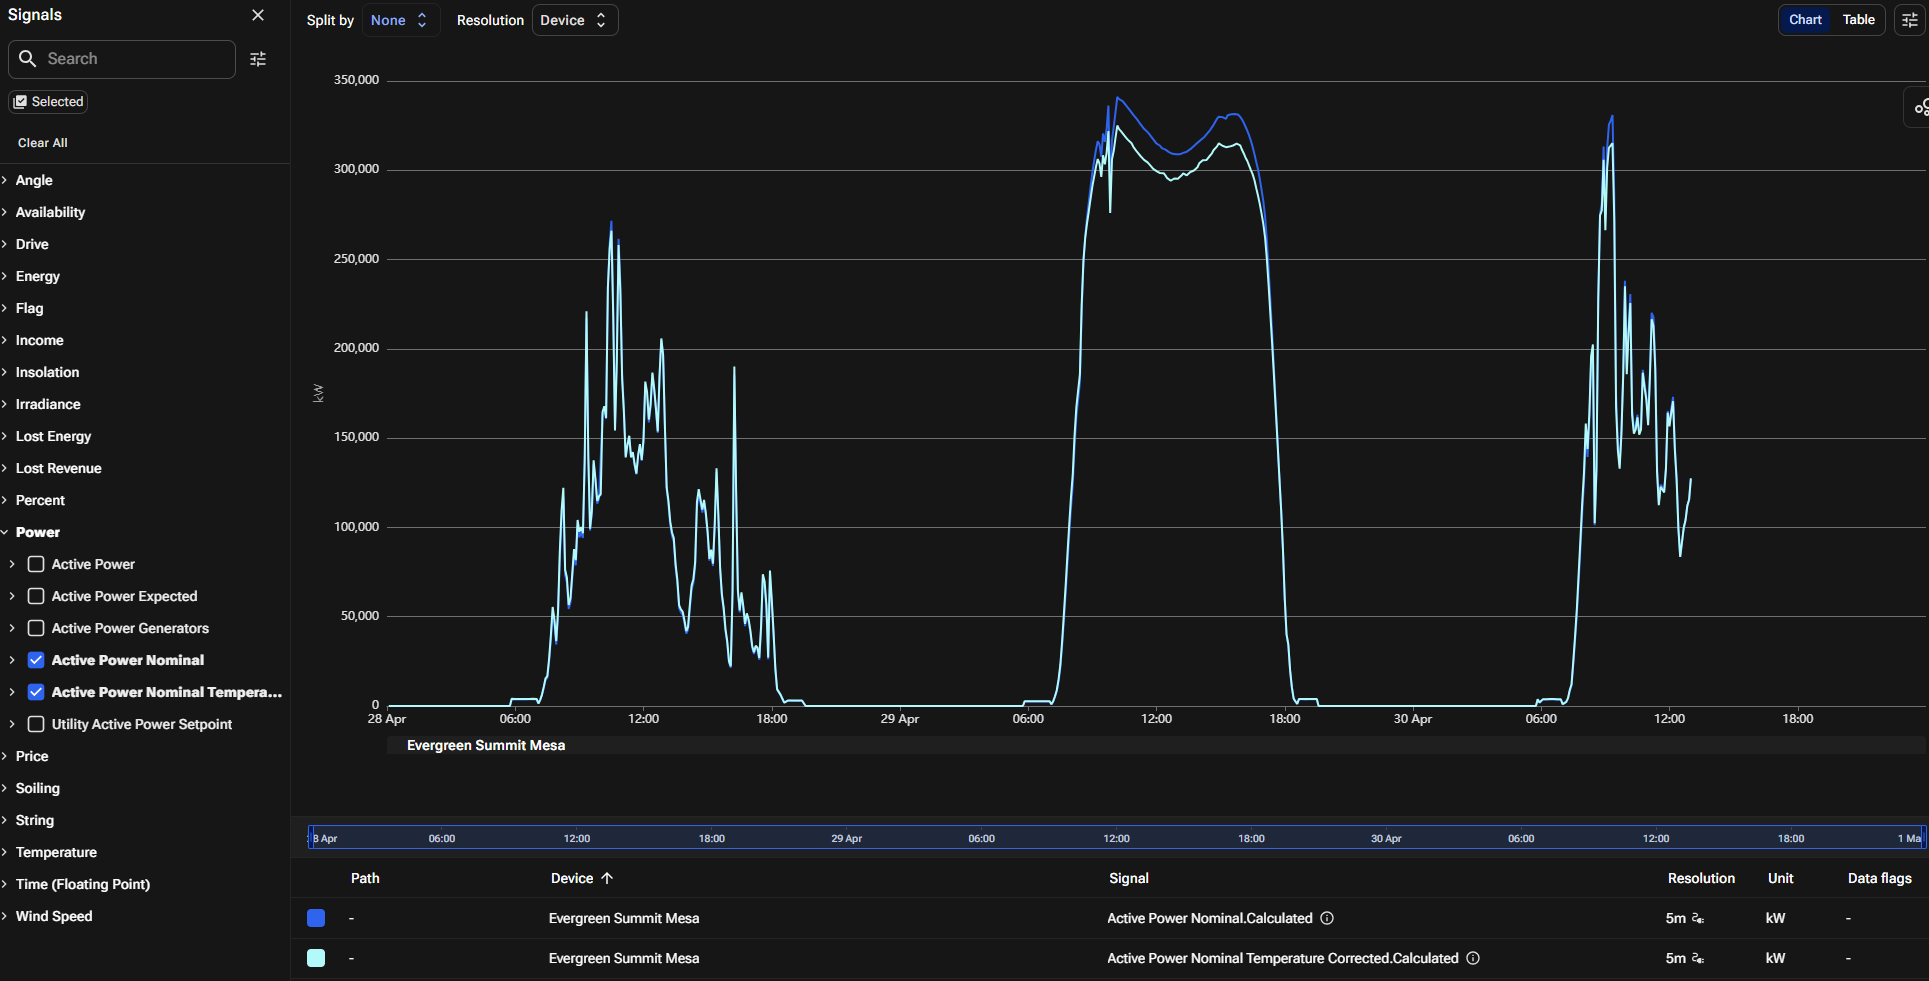
You can now access Active Power Nominal and Active Power Nominal Temperature Corrected at Site level for all your PV sites are now available as rollups from all inverters for PV Sites. These are convenience signals for use in visualizations, reporting and KPI calculations.
In some cases the Utility curtailment set point is a combination of the Power setpoint and a curtailment flag. The logic being that the Power setpoint is only applicable when the flag has a specified value (usually, 1). Now, Unity APM supports sites which has this setup.
There was a small inconsistency found between the definitions of Active Power.Final values at the Site and Generator devices. This discrepancy has now been removed and the signals are aligned making results more traceable. We've also added a check so that the Expected Production value can never be below zero. This avoids negative loss allocation to downtime and curtailment events.
To enhance loss walk visualizations for sites with two primary meters, you can now access Active Gross Export Energy at the site level. This supports specific reporting and visualization scenarios by representing only exported energy.
In most cases, Active Gross Export Energy will match Active Energy Export. However, differences arise at sites with multiple meters where some register export and others register import.
Active Export Energy is the sum of positive ActivePower from all primary meters. Import values are excluded.
Active Gross Export Energy, on the other hand, includes only the energy exported by meters registering export and excludes any import values.
This distinction ensures a more accurate representation of exported energy in complex metering configurations.
You can now access Inverter Daytime Seconds at site-level calculation for PV sites that indicates the length of daylight time in seconds per day. This is an intermediate calculation for use in downstream calculations, particularly for NERC GADS reporting.
Was this article helpful?
That’s Great!
Thank you for your feedback
Sorry! We couldn't be helpful
Thank you for your feedback
Feedback sent
We appreciate your effort and will try to fix the article